The histogram is a powerful tool for analyzing and adjusting tones in your photos. We put together this article to help you understand the histogram, including how to interpret its behavior, and how to use the tools in the panel.
What is the Histogram?
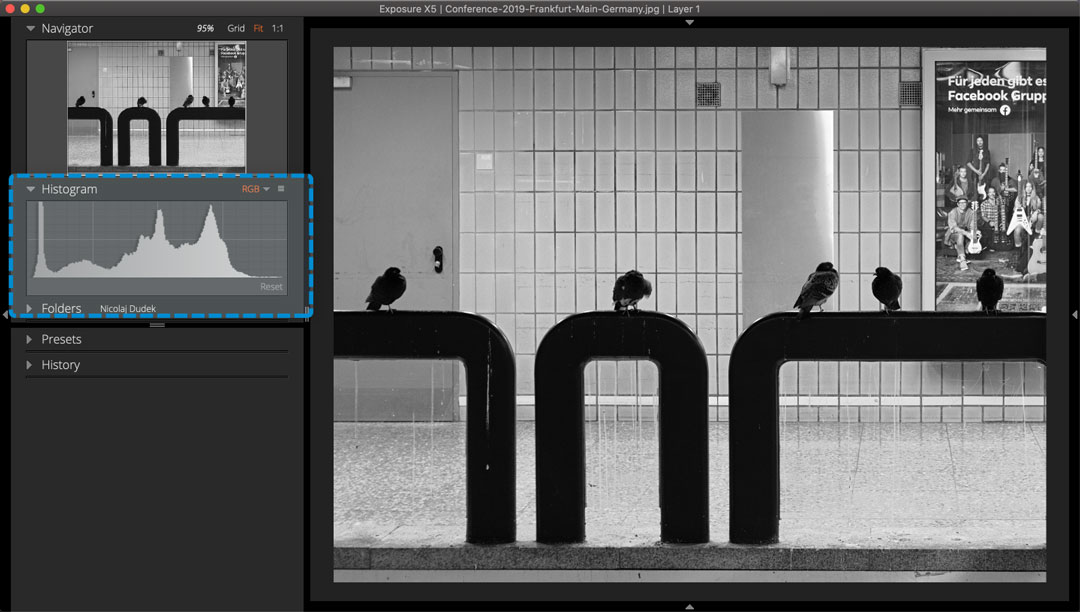
The histogram is a display of the distribution of tones captured in a photo. It graphs the tone values at each level of brightness found in the photograph. The graph ranges from black (0% brightness) on the left, to white (100% brightness) on the right. This visual depiction of the tone values enable you to instantly understand the exposure of an image. You can see whether any details are being lost to under or overexposure.
Histogram Tools
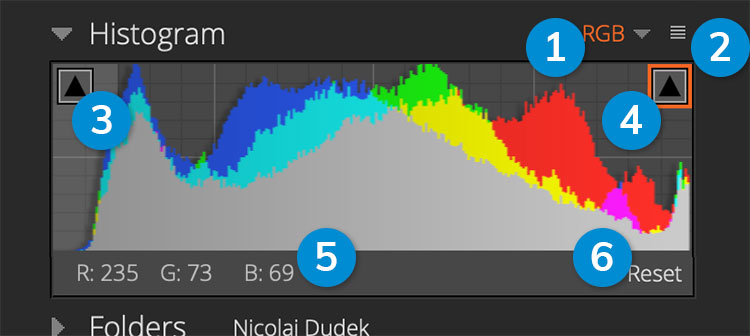
1 – Channel Selector
Select to display individual color channels Red, Green, or Blue, or display all colors on a combined histogram.
2 – Menu Button
Click the menu to customize the shadow or highlight clipping thresholds, or set the color sample size.
3 – Shadow Clipping
When active, displays a bright blue highlight on pixels in the image that are close to the set shadow clipping value.
4 – Highlight Clipping
When active, displays a bright red highlight on pixels that are close to the highlight clipping threshold. Highlight clipping is active in the example image.
5 – Color Sample
Hover over the preview image to display the color channel values for the selected pixel.
6 – Reset Button
Resets all tone adjustments applied to the selected image(s).
Interpreting the Histogram
The histogram values are grouped into zones that correspond to the controls on the Basic panel. Edits can be applied to the image and the effects will be reflected in the histogram in real-time.
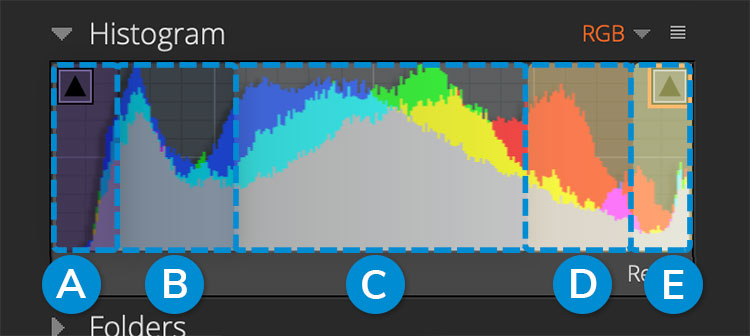
A – Blacks
Darkest pixels in the image that we cannot differentiate or see detail. Controlled by the Blacks slider in the Basic panel.
B – Shadows
Dark areas, but we can see details and differentiate between colors. Controlled by the Shadows slider in the Basic panel.
C – Midtones
The largest zone in the histogram. Controls where we can see clear details and colors. The Exposure slider controls the tones in the middle of the histogram, the largest selection of tones in the image.
D – Highlights
Bright color pixels with less contrast. Controlled by the Highlights slider in the Basic panel.
E – Whites
The brightest pixels in the image. These are so bright that our eyes can’t differentiate between details or color. The Whites slider controls this section of tones.
Histogram Examples
The histogram provides a lot of detail about the image. The shape of the histogram tells you the range of tones captured in the photo. At a glance, it identifies whether any details are lost due to over or under exposure. Below are common histogram graph shapes and descriptions of what each one means for the photo.
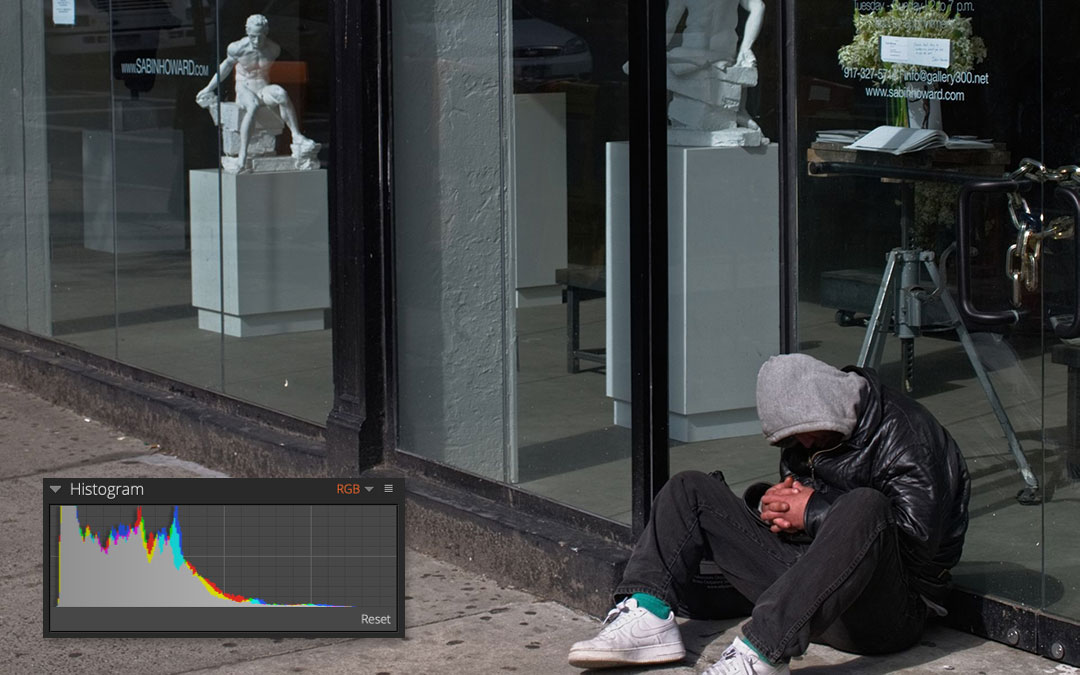
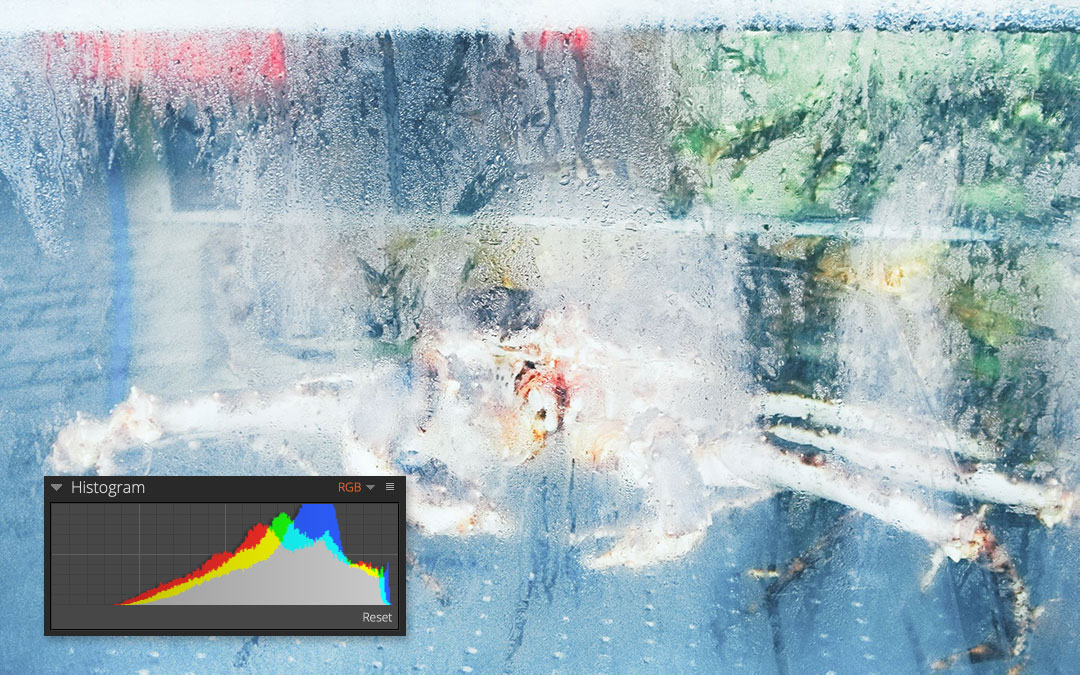
Low Contrast
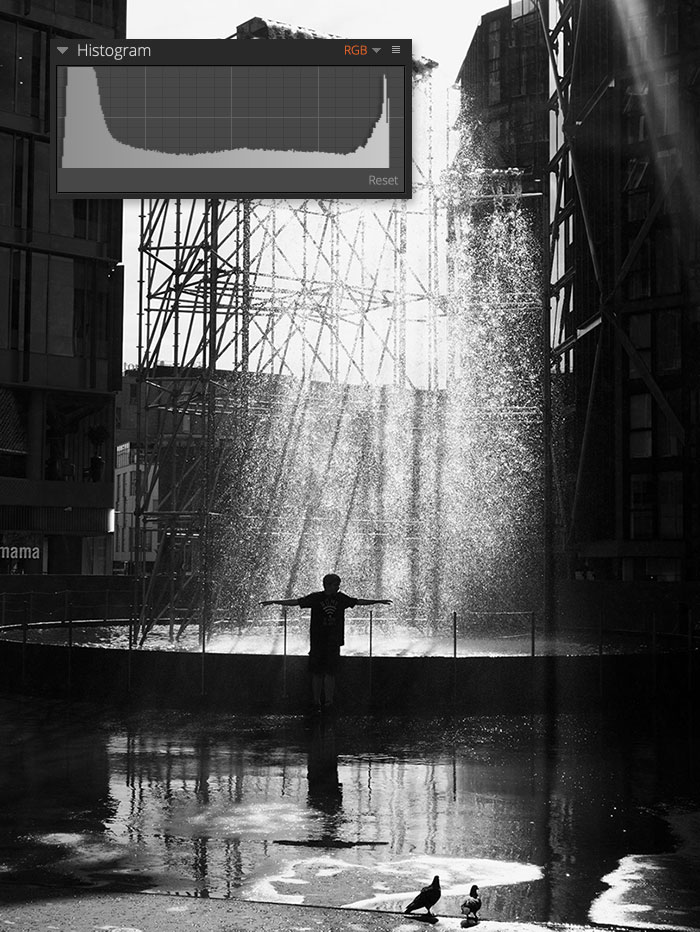
High Contrast
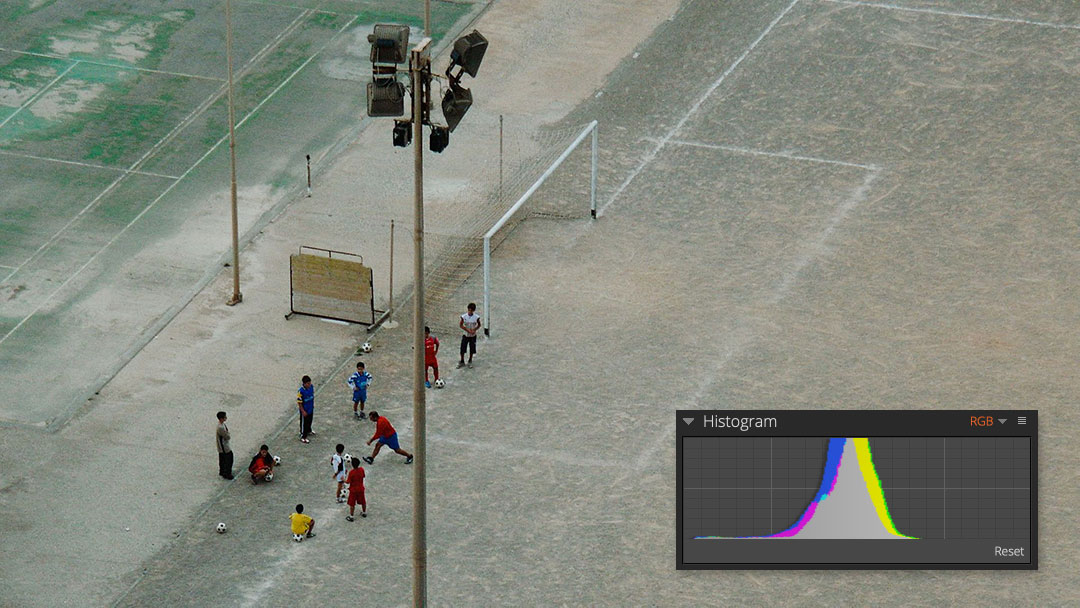
Underexposed
Overexposed
Controlling the Histogram
The histogram can be directly modified by clicking and dragging in each zone. Applying edits this way is exactly the same as using the sliders in the Basic panel.
Clipping Warnings
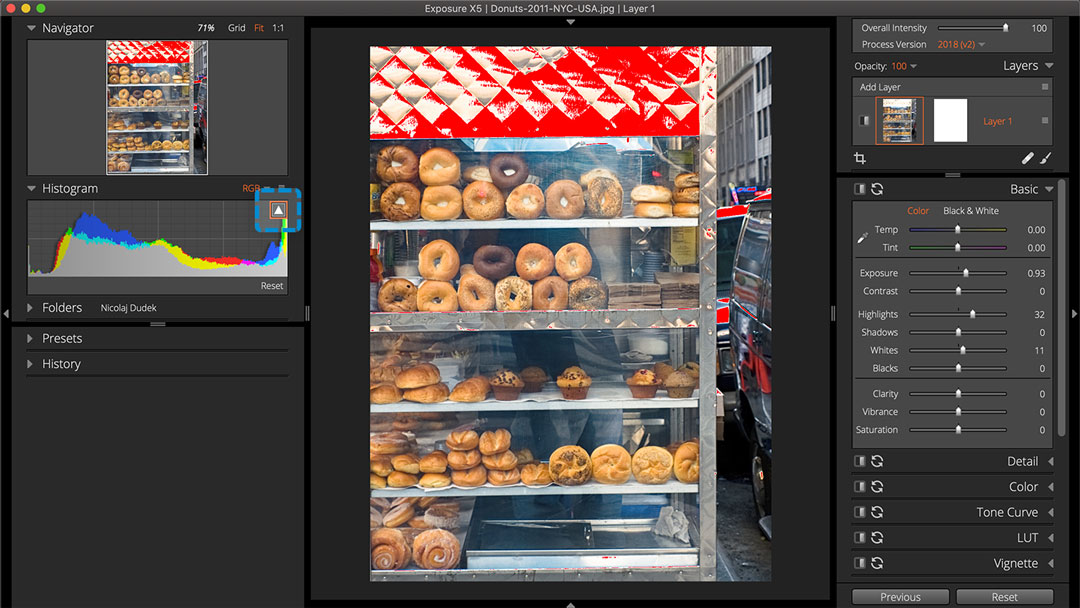
Exposure will warn you if the tones in the photo are dark or bright enough that detail is clipped and lost. Clipping is where the intensity in the image falls outside the minimum or maximum intensity that can be represented. When pixels meet the threshold for clipping, triangle icons appear at the top corners to indicate whether the clipped pixels are in the shadows or highlights.
The color of the icon will change depending on what colors are being clipped. Black indicates no colors are being clipped. White indicates multiple colors are being clipped.
Click the arrow icon to activate the clipping warning on the large preview image. Toggle highlight clipping with the arrow on the right or press F8. Toggle shadow clipping with the left arrow, or F7.
The clipping thresholds can be adjusted to your preference. Access the controls via the menu at the top of the panel.
The sample size can be adjusted. Use a single pixel or a 5×5 weighted average. In most cases, the weighted average is the better option.
As you can see, the histogram is a powerful feature with easy-to-use tools that make your photo editing workflow smooth. Save a link to this article for your reference. Thanks for reading.