
Evaluating the exposure of digital images is simple with the histogram. It enables you to determine proper exposure at a glance, ensuring that none of the image’s pixel data is compromised or missing, and to make the appropriate adjustments.
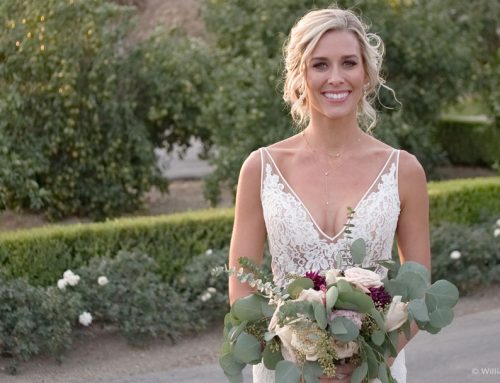
Photo: Robert Whelan
Transcript
What is the Histogram
The histogram is a visual representation of the tonal levels in an image. It plots the strength of tones of particular brightnesses in a photograph. The tones range from black on the left of the histogram to white on the right. This is useful for monitoring levels during editing because it updates in real-time as you make adjustments.
Interpreting the Histogram
The histogram is separated into zones that correspond to the controls on the Basic panel. On the left are the darker tones in the photo, the shadows and the very darkest values are blacks. To the right are the bright tones, the highlights and the whites which are the brightest. The Exposure slider controls the tones in the middle of the histogram, which is the largest selection of tones.
The histogram might look like a hill or ridge with several peaks, this indicates that the image has mostly midtones and no areas with blown-out highlights or blocked up shadows.
The histogram might look flat in the middle with high peaks at both edges, this indicates that the image has high contrast, and that there may be areas of the image with clipped values.
If the image selected has more of a certain color, that color will be more prevalent in the histogram.
Histogram controls
Each zone of the histogram can be directly selected to control the images’ tones. Simply click and drag each zone in the histogram and the corresponding slider will be adjusted on the Basic panel.
If the levels in the photo are dark or bright enough that detail is close to being lost, a clipping warning is displayed. Arrow icons appear at the top corners of the histogram to indicate shadow or highlight clipping. Click the arrow in the histogram to highlight the clipped tones with a bright color overlay. Toggle the clipping warning on and off with F8 for the highlights and F7 for the shadows. The clipping threshold can be adjusted per your preference with the menu at the top of the panel.
For detailed color information about the image, hover the cursor over the image to display the amounts of red, green and blue for the sample area. The numbers will appear beneath the histogram.